WINGSUIT NERDING
A note from Matt G., Minister of Propaganda at SQRL Corporation
The story of the CORVID began with a request from some of our friends and team members: Can we make a new suit design for overall wingsuit BASE performance, but with a focus on ease in the start? Something that offers a more generous feeling of margin for demanding jumps (shorter starts, less overall vertical, and more rugged terrain than average European valleys). The idea was a suit that returned to the roots of the original AURA (easy toggle access, easy starts, stability and comfort) but still had the glide performance and efficiency of our more modern range.
This is not a suit that I would have thought of on my own, and it is totally the result of listening to our team. The A3 was my vision for this category in BASE. But… when Hartman, Rich, Pat, and Scotty came to me with a request for something different, it was obvious that we should follow their lead. CORVID does not replace the A3, the two suits each have their own distinct applications. We are always happy to give our recommendation when you are trying to decide what suit is for you, so email me anytime.
CORVID’s basic planform is an evolution of the C3 and A3 with an arm sweep more similar to the original AURA. Development and testing took place during the 2018 summer & fall. Below is an excerpt (some things redacted) of a conversation about measuring start performance during the end of testing. I wanted to share this with anyone who might be interested because the work that these guys have put into defining metrics for WS BASE is really impressive and benefits the entire community. Hartman (a badass engineer, it turns out) deserves recognition for the incredible analyses he has completed on WS performance in the BASE environment. He has also developed a wingsuit flight modeler which calculates performance based on variable factors. You can enter values such as wingloading, alt MSL, push speed, wind & lift, etc, and get a projection. Pretty useful when you are jumping exits close to the limit of what’s currently possible.
Huge thanks to Hartman Rector (engineer, decade+ in BASE), Pat Walker (generally the best overall skydiver / BASE jumper you’ve never heard of), Rich Webb (Former US Navy pilot, founder of www.topgunbase.ws), and Scotty Bob (the generous ninja who cares more for you and your progression than you realize) for their initiative on gear progression, and commitment to helping others stay safe in the sport, and for their help getting this suit done.
-Matt
Ps. In case you haven’t already googled the meaning of CORVID, it’s a smart AF family of birds.
- HR
From: Hartman Rector
To: Matt G - Squirrel ; 'Will Kitto' ; 'Richard Webb'; Pat ; Robert Morgan
Subject: Corvid testingHey guys,
I'm working on a report maker so I figured I would get some feedback from you guys on what we need to be looking at.
The report looks at the push, start, then entire flight.
The first pdf is Pat's first jump on the Corvid (red data) at Blacksmith compared to an A2 jump of his same-ish line in similar-ish conditions a couple weeks ago.
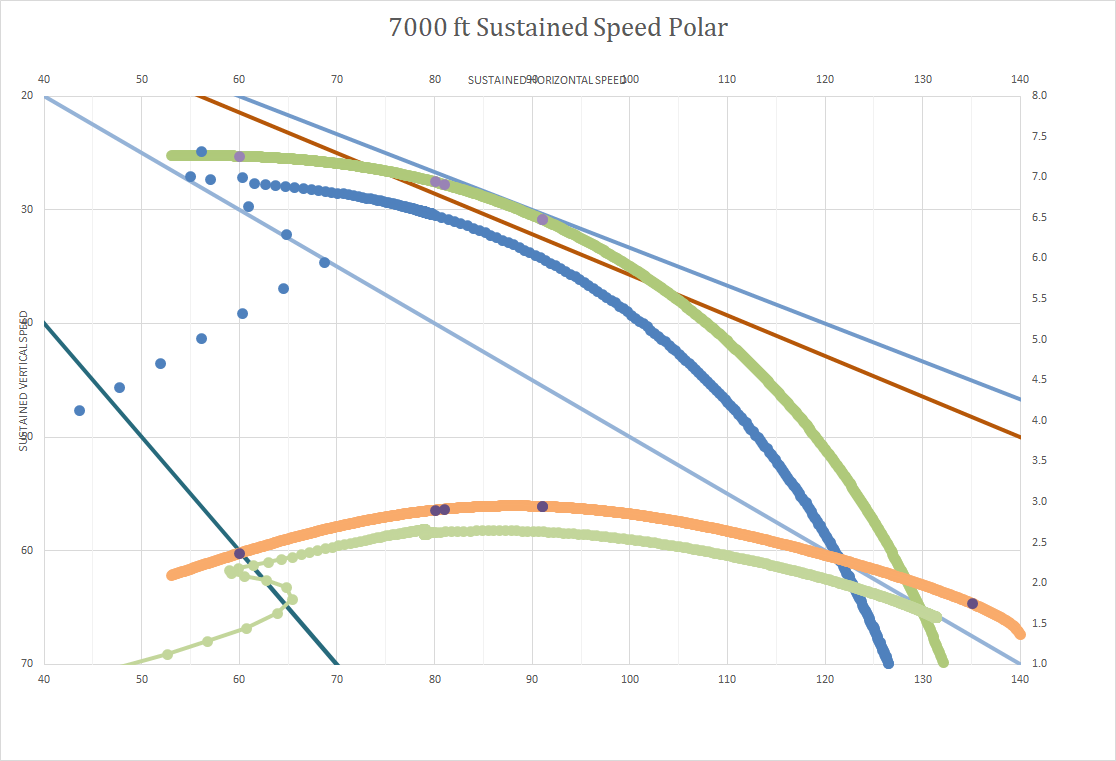
2nd pdf is 2 jumps at the west wall at notch. 2 ways all flying the same line (diving start through notch into west gully) all with the Corvid, 2-6 mph of lift at exit, under 5mph in the landing. I bet max glide for me is around 83MPH horizontal speed @7000ftmsl judging from the start polar (pg3), definitely better glide than the A2. I will make an estimate for the entire Corvid polar in the next couple days.
The Corvid flies beautifully, great start performance, glides and flares better than the A2 looks like the best parts of the A2 and A3. Feels lighter than the A2 and the A3, doesn't require as much input as the A2 and has better feel than the A3.
-Hartman
- MG
From: Matt - SQRL
To: 'Hartman Rector'; 'Will Kitto' ; 'Richard Webb'; 'Pat'; 'Robert Morgan'
Subject: RE: Corvid testingHi Guys,
This stuff is interesting. Is there a simpler way to make a more accurate comparison? There must be a formula combining stall speed and glide performance to calculate start performance.
The polars are useful in the sense that they backup what you guys are feeling in real life. But your perception and experience in the suit is enough, even without the data.
Thanks
Matt
- PW
From: Pat Walker
To: Hartman Rector ; Richard Webb
Cc: Matt G - Squirrel ; Will Kitto ; Robert Morgan
Subject: Re: Corvid testingI still have so much to learn about all of this stuff. Hartman has shown me a lot.
Being able to have hard data to compare suits has been really helpful. Right now, I mostly look at glidepath data, horizontal/vertical speeds, and the polar.
It can be hard to determine some of the suits characteristics based only on feel. When we got the Corvid, being able to see the polar improved at both the bottom and top end helped confirm what we were feeling in flight. It was also nice seeing the correlation between better performance at the low end of the polar and better starts...
For r&d purposes and personal analysis of the flight, I find the complex data to be priceless when operating on the edge of the suits performance. Starts, max glide and flares seem to be the most applicable to me in the base realm.
For personal analysis, at the moment, I like to look at the glide path graph to analyze my starts. Using only that graph, it doesn't tell me the whole story. Looking at the horizontal and vertical speed graph I am able to see a much clearer picture of what is happening. Was my start worse because I used altitude to create more speed?
It has also been nice being able to analyze different parts of my flight. On one of my first jumps on the suit, the last half of the flight I was trying to find max glide. We looked at the data comparing my horizontal speed to where max glide would be on the polar. Remarkably, I was sitting at the high end of what best glide would be, right where I wanted it. It was nice to get near instant feedback of what was actually happening during the flight. I think it would have taken dozens of jumps to learn less than what I learned on that one jump with data analysis.
Cheers,
Pat
- HR
From: Hartman Rector
To: Richard Webb
Cc: Matt G ; Will Kitto ; Pat Walker ; Robert Morgan
Subject: Re: Corvid testingOk,
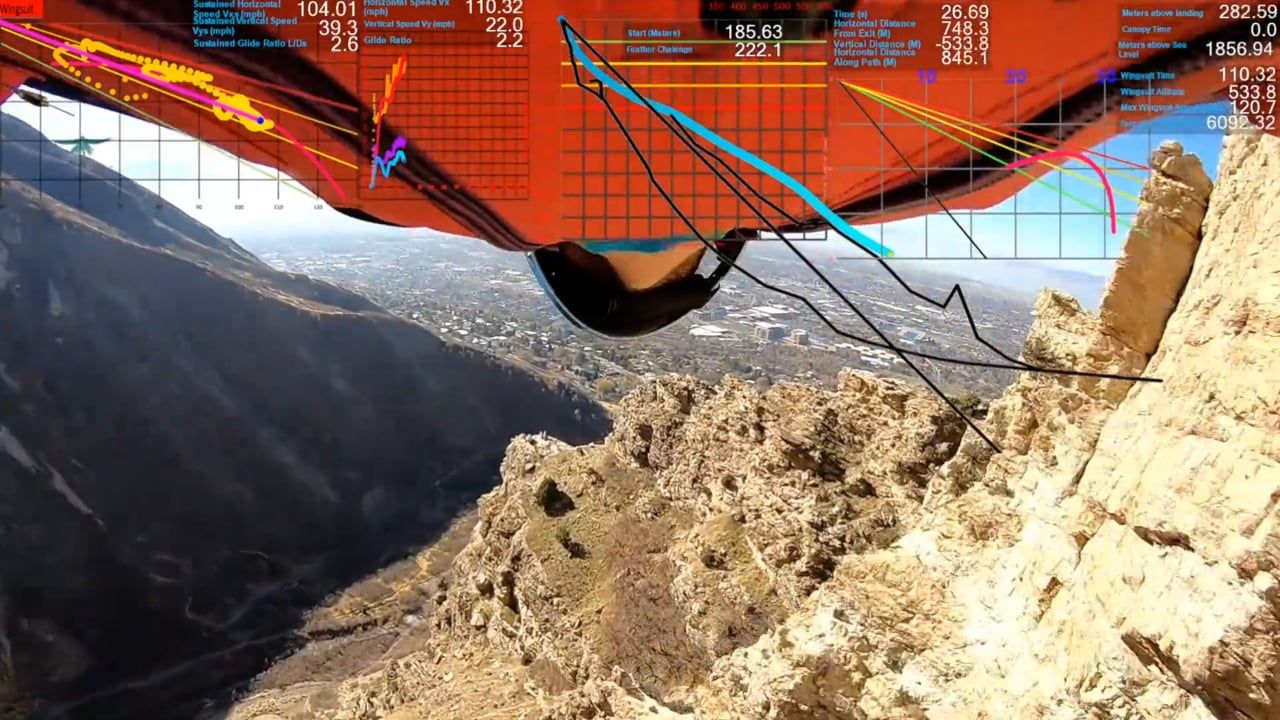
New tools, Matt suggested I try the dashware program. You can waste lots of time with this one. Here are a couple videos I made [embedded at bottom].
I think just the 7000ft polar with a good reference line tells me more about the conditions and flight than the rest of everything combined.
Matt,
I have a cartoonishly oversimplified answer to your stall speed start formula
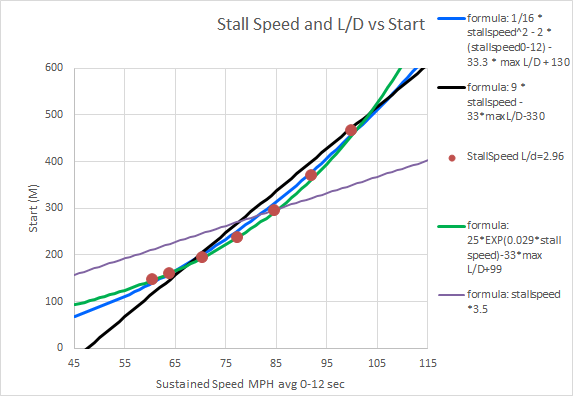
Start (meters) = stall speed (mph) * 3.5
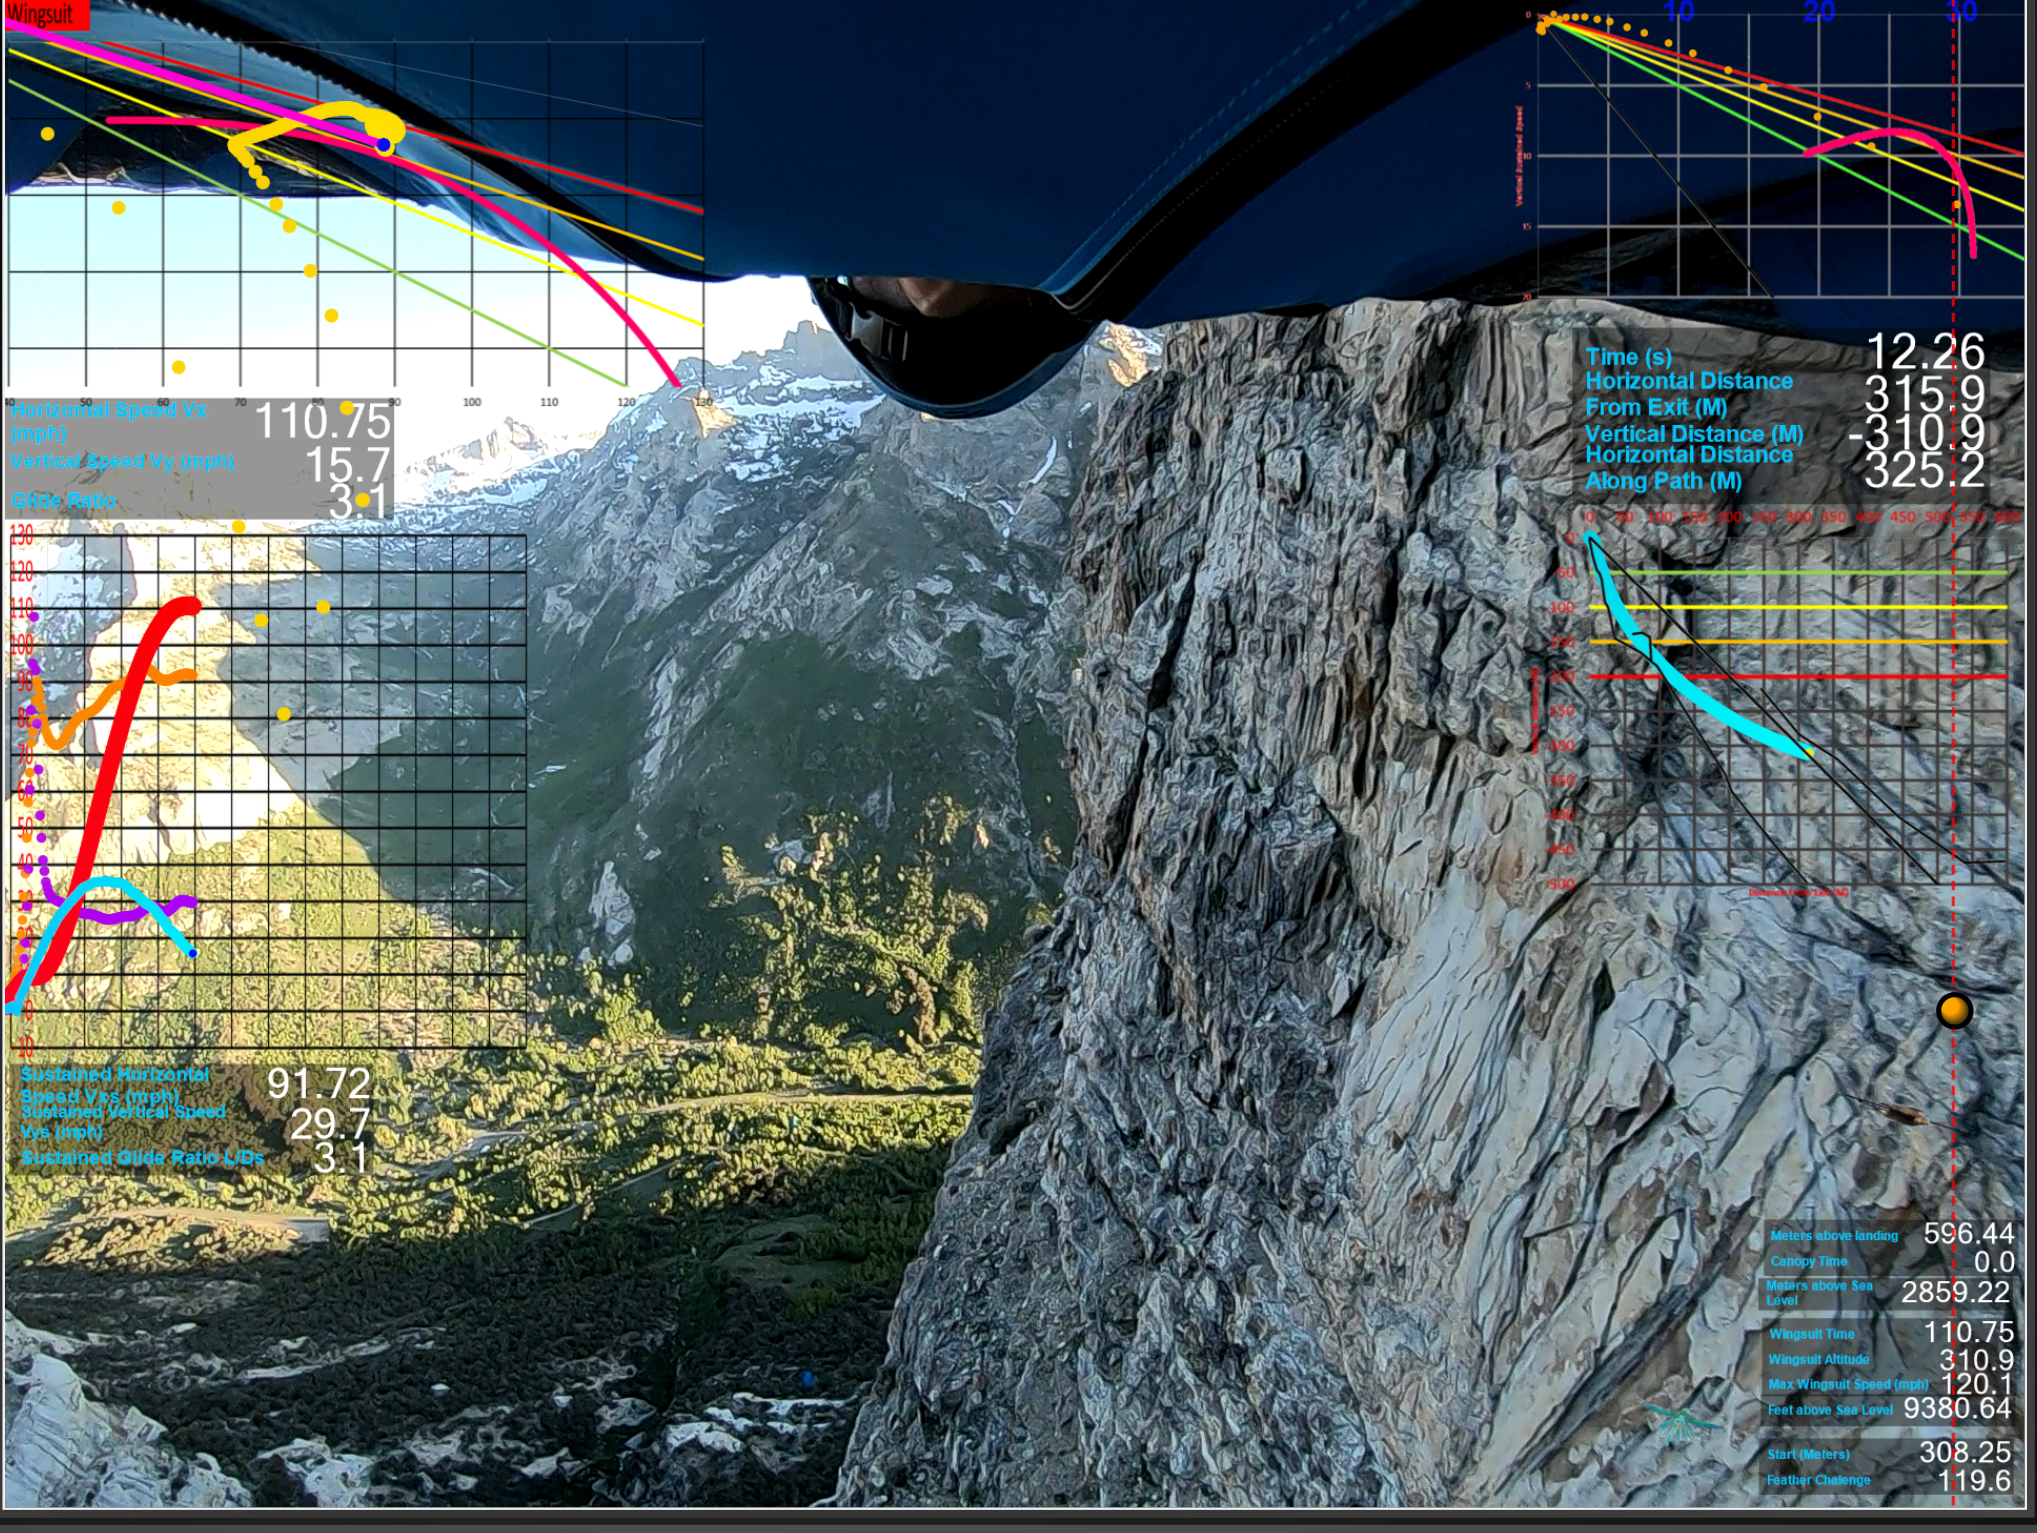
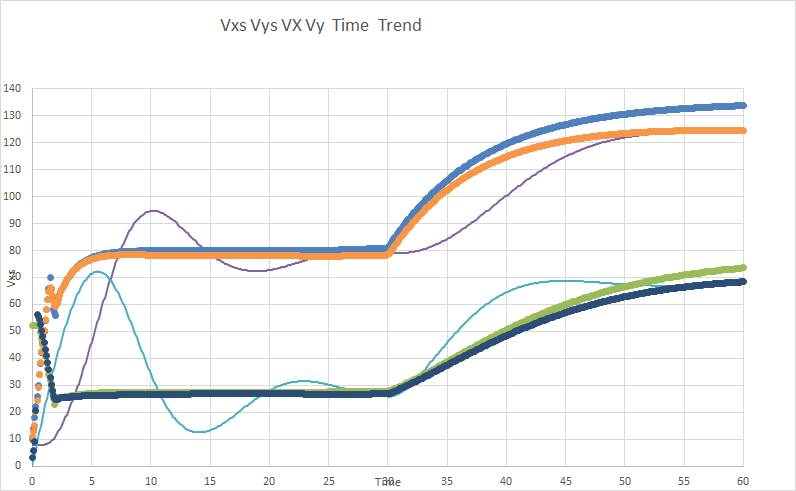
This is actually a pretty close estimate if you define stall speed as the horizontal sustained speed you average during the start, which is not a bad estimate if you are trying to start as fast as possible. Maybe min sink is what we are going for in the start and would be a better predictor of start performance here are some pictures:
![Nerds Image]()
Vxs (orange on speed graph) is average around 85mph *3.5 = 297.5 very close to the 308 meter start recorded on the bottom right.
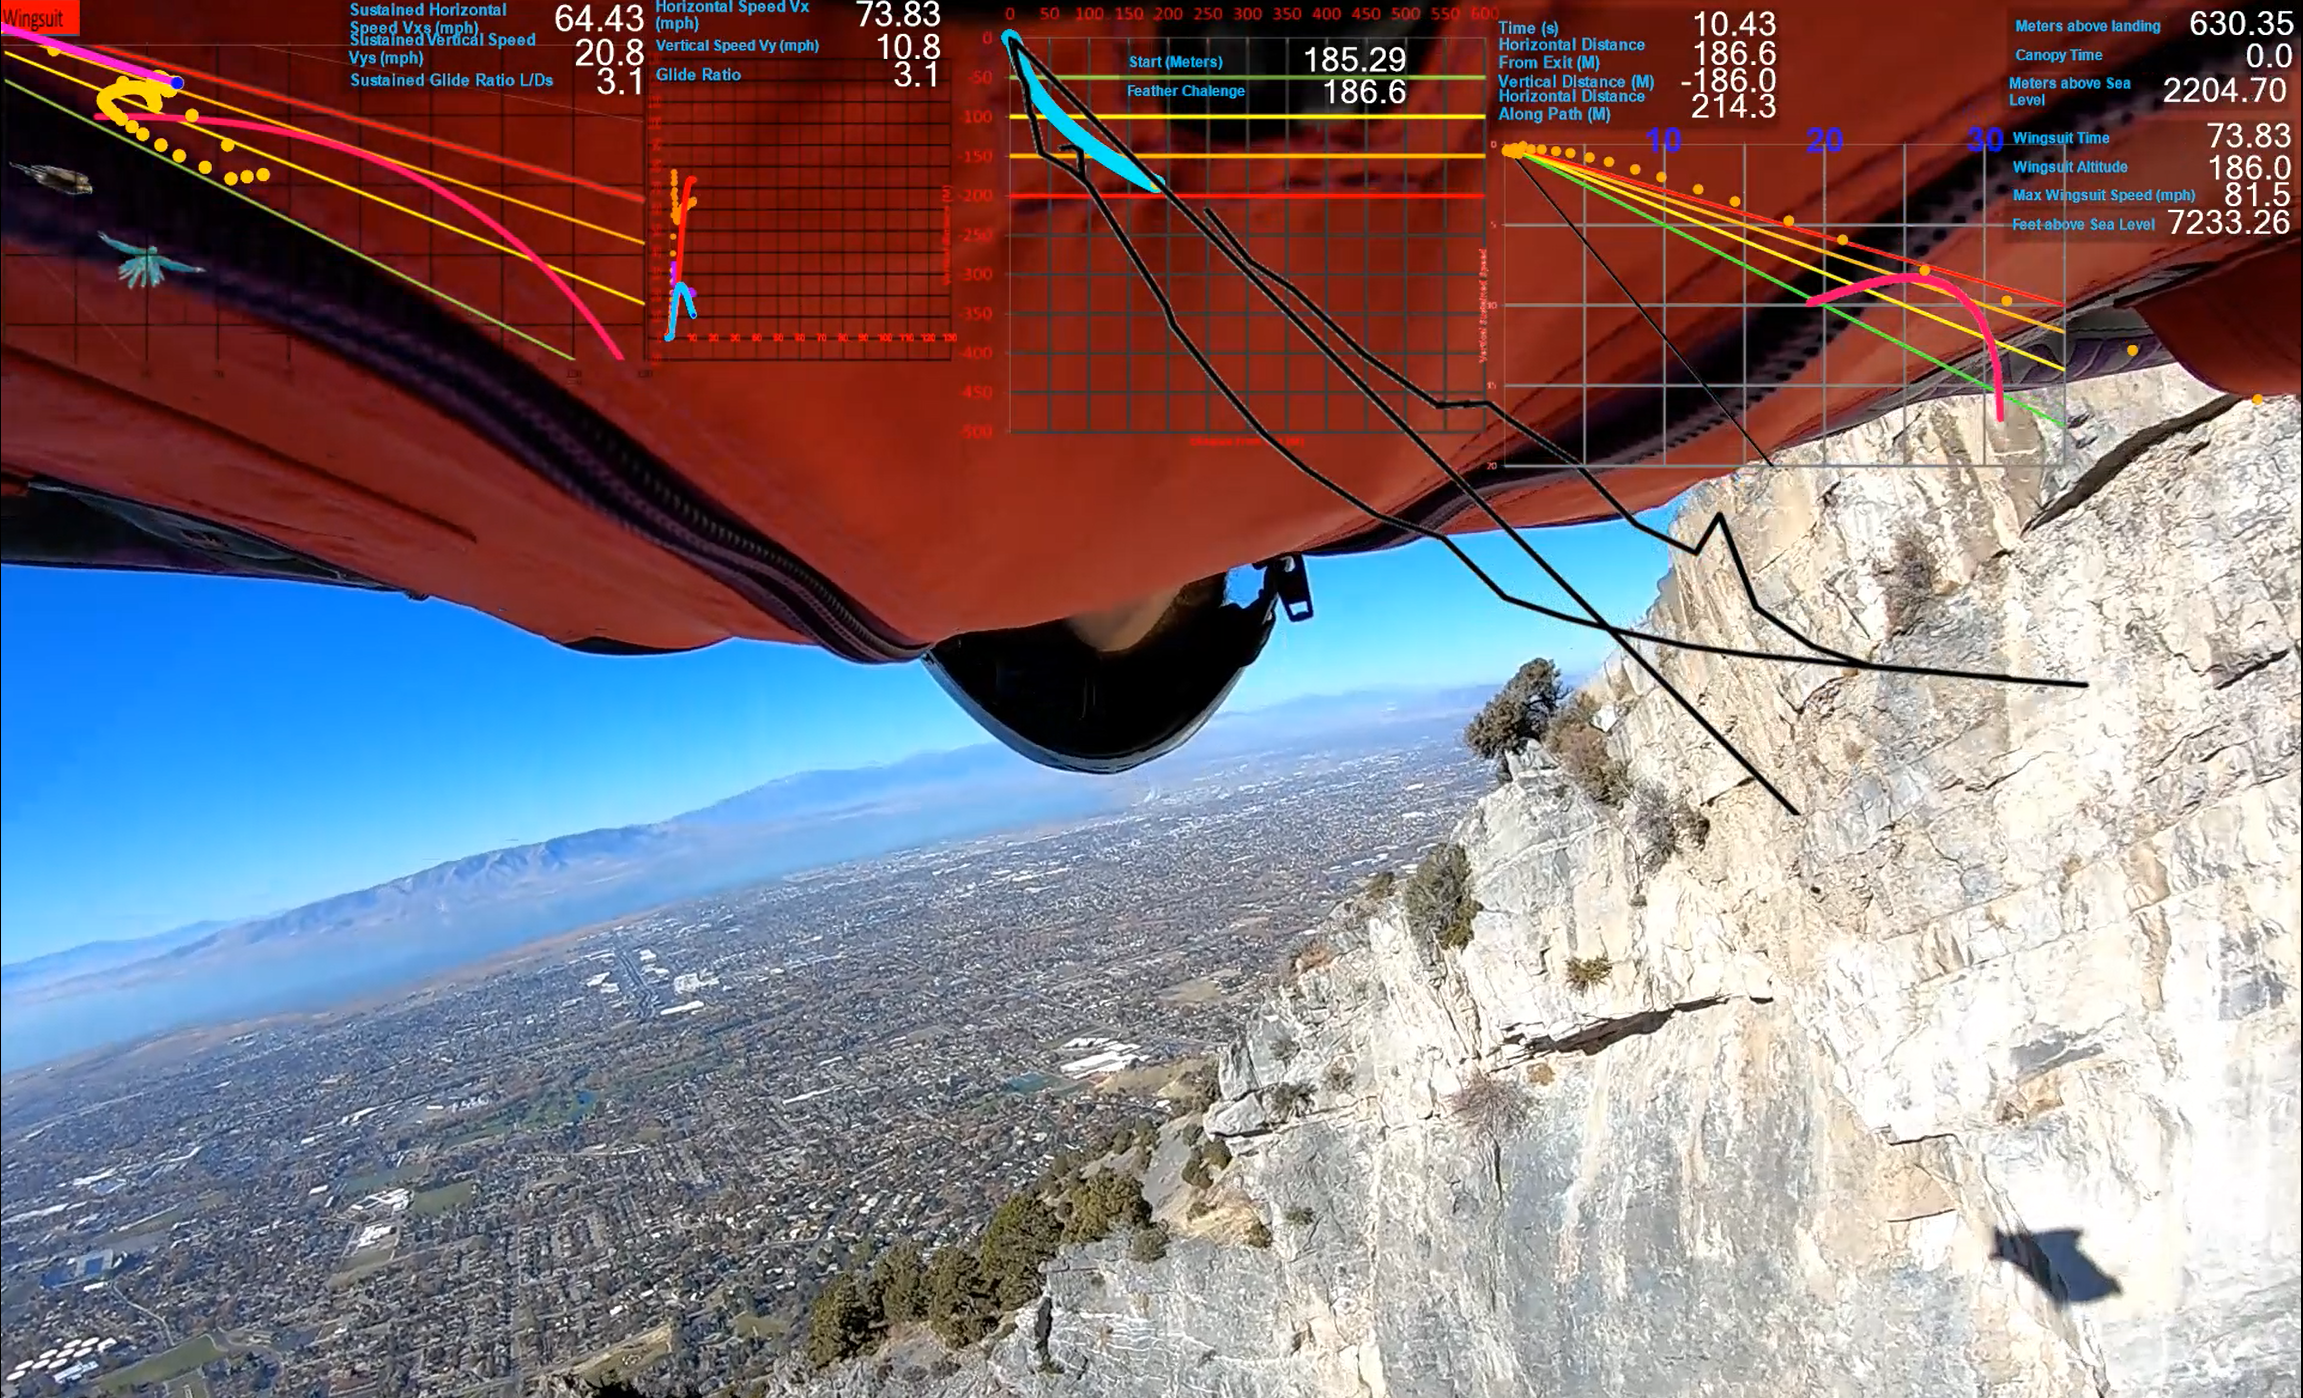
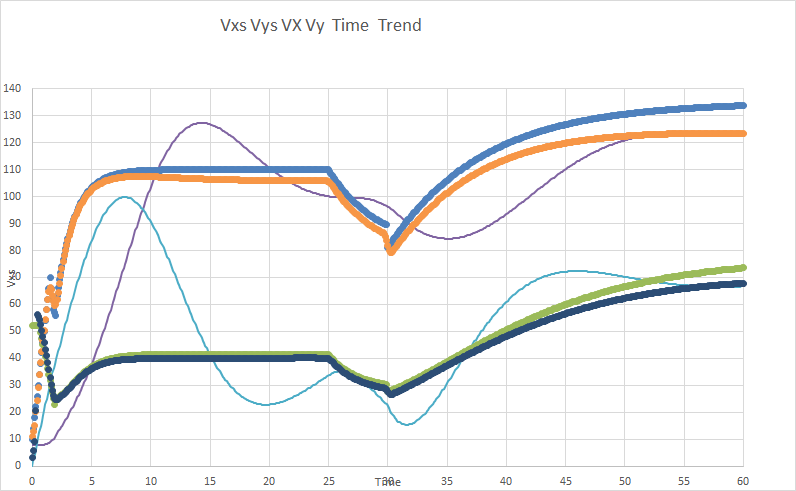
Here is a fast start:
![Nerds Image]()
Sorry its hard to see but the orange Vxs line is averaging around 57 mph * 3.5 = 199.5 pretty close to the 185 meter start on the gps.
We know L/D plays in to it for sure, but the start is much more heavily dependent on the magnitude of the coefficients, Vxs lower = faster starts. And we are trying to fly the suit right above the stall speed to get the fastest start, so maybe stall point is the best predictor.
I could do some statistical wizardry and look at the average values of this stuff for a bunch of jumps to see which are the best predictors I've done that a bunch and you don't always see what you are looking for sometimes you dive in the start and an average for the first 12 sec won't really cut it... or I can use the modeler, it always has all the answers.
I set up the modeler for an average c-race style start and changed the polar by scaling L/D between 3.3:1 to normal 3:1 green to 2.6 blue like this:
![Nerds Image]()
I changed the stall speed or min sink or whatever we are flying at in the start like this (we are only concerned with the first 12 sec):
![Nerds Image]()
![Nerds Image]()
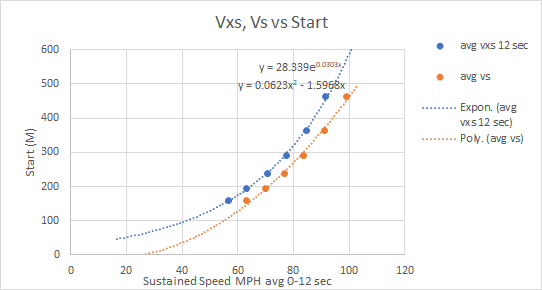
Here is the data:
![Nerds Image]()
The relationship between sustained speed and start appears to be quadratic or exponential roughly 8 meters per mph in the range we are looking at I decided to use Vs as the metric instead of Vxs.
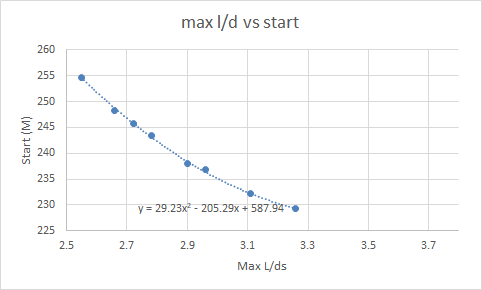
Here is L/d:
![Nerds Image]()
Looks like 3.5 meters for every .1 points of L/D. The way we measure the start really takes any L/D advantage out of the picture. the feather challenge would be more of a mix between L/D and speed but start is almost all speed.
Here are a couple equations and how they fit the data, take your pick:
![Nerds Image]()
-Hartman

